
The return your broker shows you isn't the return you think it is
"Return" isn't one number. It's the answer to a question — and two different questions are hiding inside that one innocent percentage.
You hold the same money in two places. One app says you're up 8.1% this year; the other says 14.6%. Same rand, same trades, two answers more than six points apart — and neither screen tells you how it got there. Here's why they disagree, and which one is actually yours.

Identical 12-month portfolio, identical trades. The gap exists only because a R200,000 contribution landed just before the strong second half — money-weighted return rewards that timing; time-weighted strips it out. Figures verified; illustrative path.
You hold the same money in two places. You open the first app and it tells you your portfolio is up 8.1% this year. You open the second and it tells you you're up 14.6%. Same rand, same trades, two answers more than six points apart — and neither screen tells you how it arrived at the number, or why the other one disagrees.
If that has ever made you feel slightly mad, you are not wrong, and you are not alone. There is a Bogleheads thread, years long, titled "Vanguard's Personal Rate Of Return Calculation Is Embarrassing."[1] That is the register of a sophisticated investor who suspects the figure on their screen is misleading and resents not being able to check it. It is a fair suspicion. The numbers really do disagree, and the disagreement is not a bug.
Here is what is actually happening. J.P. Morgan and Chase show you a time-weighted return. Vanguard's personal-performance figure is money-weighted. Interactive Brokers lets you pick. The portfolio tracker Sharesight shows money-weighted by design and argues, in writing, that the time-weighted method is "less useful and potentially misleading for individual investors, who do control when cash flows in and out of their portfolios."[2] Closer to home, EasyEquities, Allan Gray and Sygnia publish fund-level performance on a lump-sum, income-reinvested, NAV basis — and then each adds a line, almost word for word, that individual investor performance may differ. That disclaimer is honest. It is also where they stop: it tells you the published number isn't yours, and leaves you to work out what yours actually is.
So the problem is not that one platform is lying. The problem is that "return" is not one number.
It is the answer to a question — and there are two different questions hiding inside that one innocent percentage.
Two questions, not two rivals
The first question is: is this fund any good? The second is: did I personally do well? They sound like the same question. They are not, and the gap between them is exactly the gap between your two screens.
A quick illustration, no formulas. You put R100,000 into a fund. Over the first six months it rises 10%, so you're sitting at R110,000. Then a bonus lands and you add R200,000. Over the next six months the fund rises another 10%. Now: how did the fund do? It did 10%, then 10% — about 21% for the year, and that's true whether you added R200,000 or nothing at all. But how did you do? Most of your money — the big R200,000 — was only riding that second 10% leg, and you happened to put it in right before a good run. Your personally experienced return is higher than the fund's, because your timing was good. Neither figure is wrong. They answer different questions. One is judging the fund; the other is judging you.
This is the whole point, so it's worth saying plainly before we touch any maths: these are two questions, not two rival methods. The mistake almost everyone makes — and the mistake a single unlabelled percentage on a screen invites — is using one number to answer the other question. You cannot tell whether Allan Gray beat Coronation by looking at a figure that's been inflated or dragged by when you happened to deposit your bonus. And you cannot tell whether your own timing helped you by looking at a figure that has deliberately stripped your timing out.
The numbers have names
Once you can see which question each one answers, the disagreement between your screens stops being maddening and starts being useful.
Time-Weighted Return (TWR) answers the first question — is the fund any good? It removes the effect of when and how much you contributed or withdrew, and measures the performance of the investment itself. This is not a niche preference; it is the global standard. The CFA Institute's Global Investment Performance Standards require a time-weighted return precisely "because it removes the effects of cash flows, which are generally client-driven" — so a fund's reported number "best reflects the firm's ability to manage the assets according to a specified strategy."[3] It is why every fund factsheet you have ever read quotes a time-weighted number. It is also the harder one to compute — and the one no South African platform gives you per fund.
Money-Weighted Return (MWR) — the one Excel calls XIRR — answers the second question: did I do well, given my timing? It deliberately keeps the size and timing of your contributions in the calculation, because that's the part it's measuring. It is your personal, experienced return. It's also where most people make their first mistake, and it's a boring one: the sign convention. Money leaving your wallet into the portfolio is negative; money coming back to you is positive. Get a sign wrong and XIRR will hand you a confident, ludicrous answer.
There is a third name you'll meet — Modified Dietz — and it causes more confusion than it should, because it sits in between. Here is the honest version. Computing a true time-weighted return the textbook way means knowing what your portfolio was worth on every single day money moved in or out — every contribution, every withdrawal. Most people don't have that. Modified Dietz is the practical workaround: it approximates a sub-period's time-weighted return by weighting each cash flow for the fraction of the period it was actually invested, so you don't need a valuation on every flow date. You then chain those sub-period returns together geometrically to build the full time-weighted return. In other words, Modified Dietz isn't a rival to TWR — it's how institutional-grade TWR is built in the real world, and GIPS explicitly permits it. The confusion comes from a second, looser use: take Modified Dietz over a single long period instead of chaining short ones, and the number it spits out drifts toward the money-weighted answer. Same formula, two very different jobs. Hold that distinction; the worked example below makes it concrete.
One real rand portfolio, carried all the way through
Every ranked page explaining this stuff uses a toy example: a portfolio that goes from R100,000 to R110,000 with one mid-year deposit. Real money isn't that tidy. So here is a realistic one, carried end to end, with every figure shown. (The numbers are illustrative, but the accounting and every computed result are exact and reproducible.)
A self-directed investor opens a 12-month window on 28 February 2026 with R500,000. They contribute R10,000 on the 1st of every month. In August a year-end bonus adds a R200,000 lump sum, and that same month they rebalance — sell some of one fund, buy another. In November they withdraw R80,000 for school fees and provisional tax. The market is weak in the first half and strong in the second — so the big August lump happens to land just before the good run.
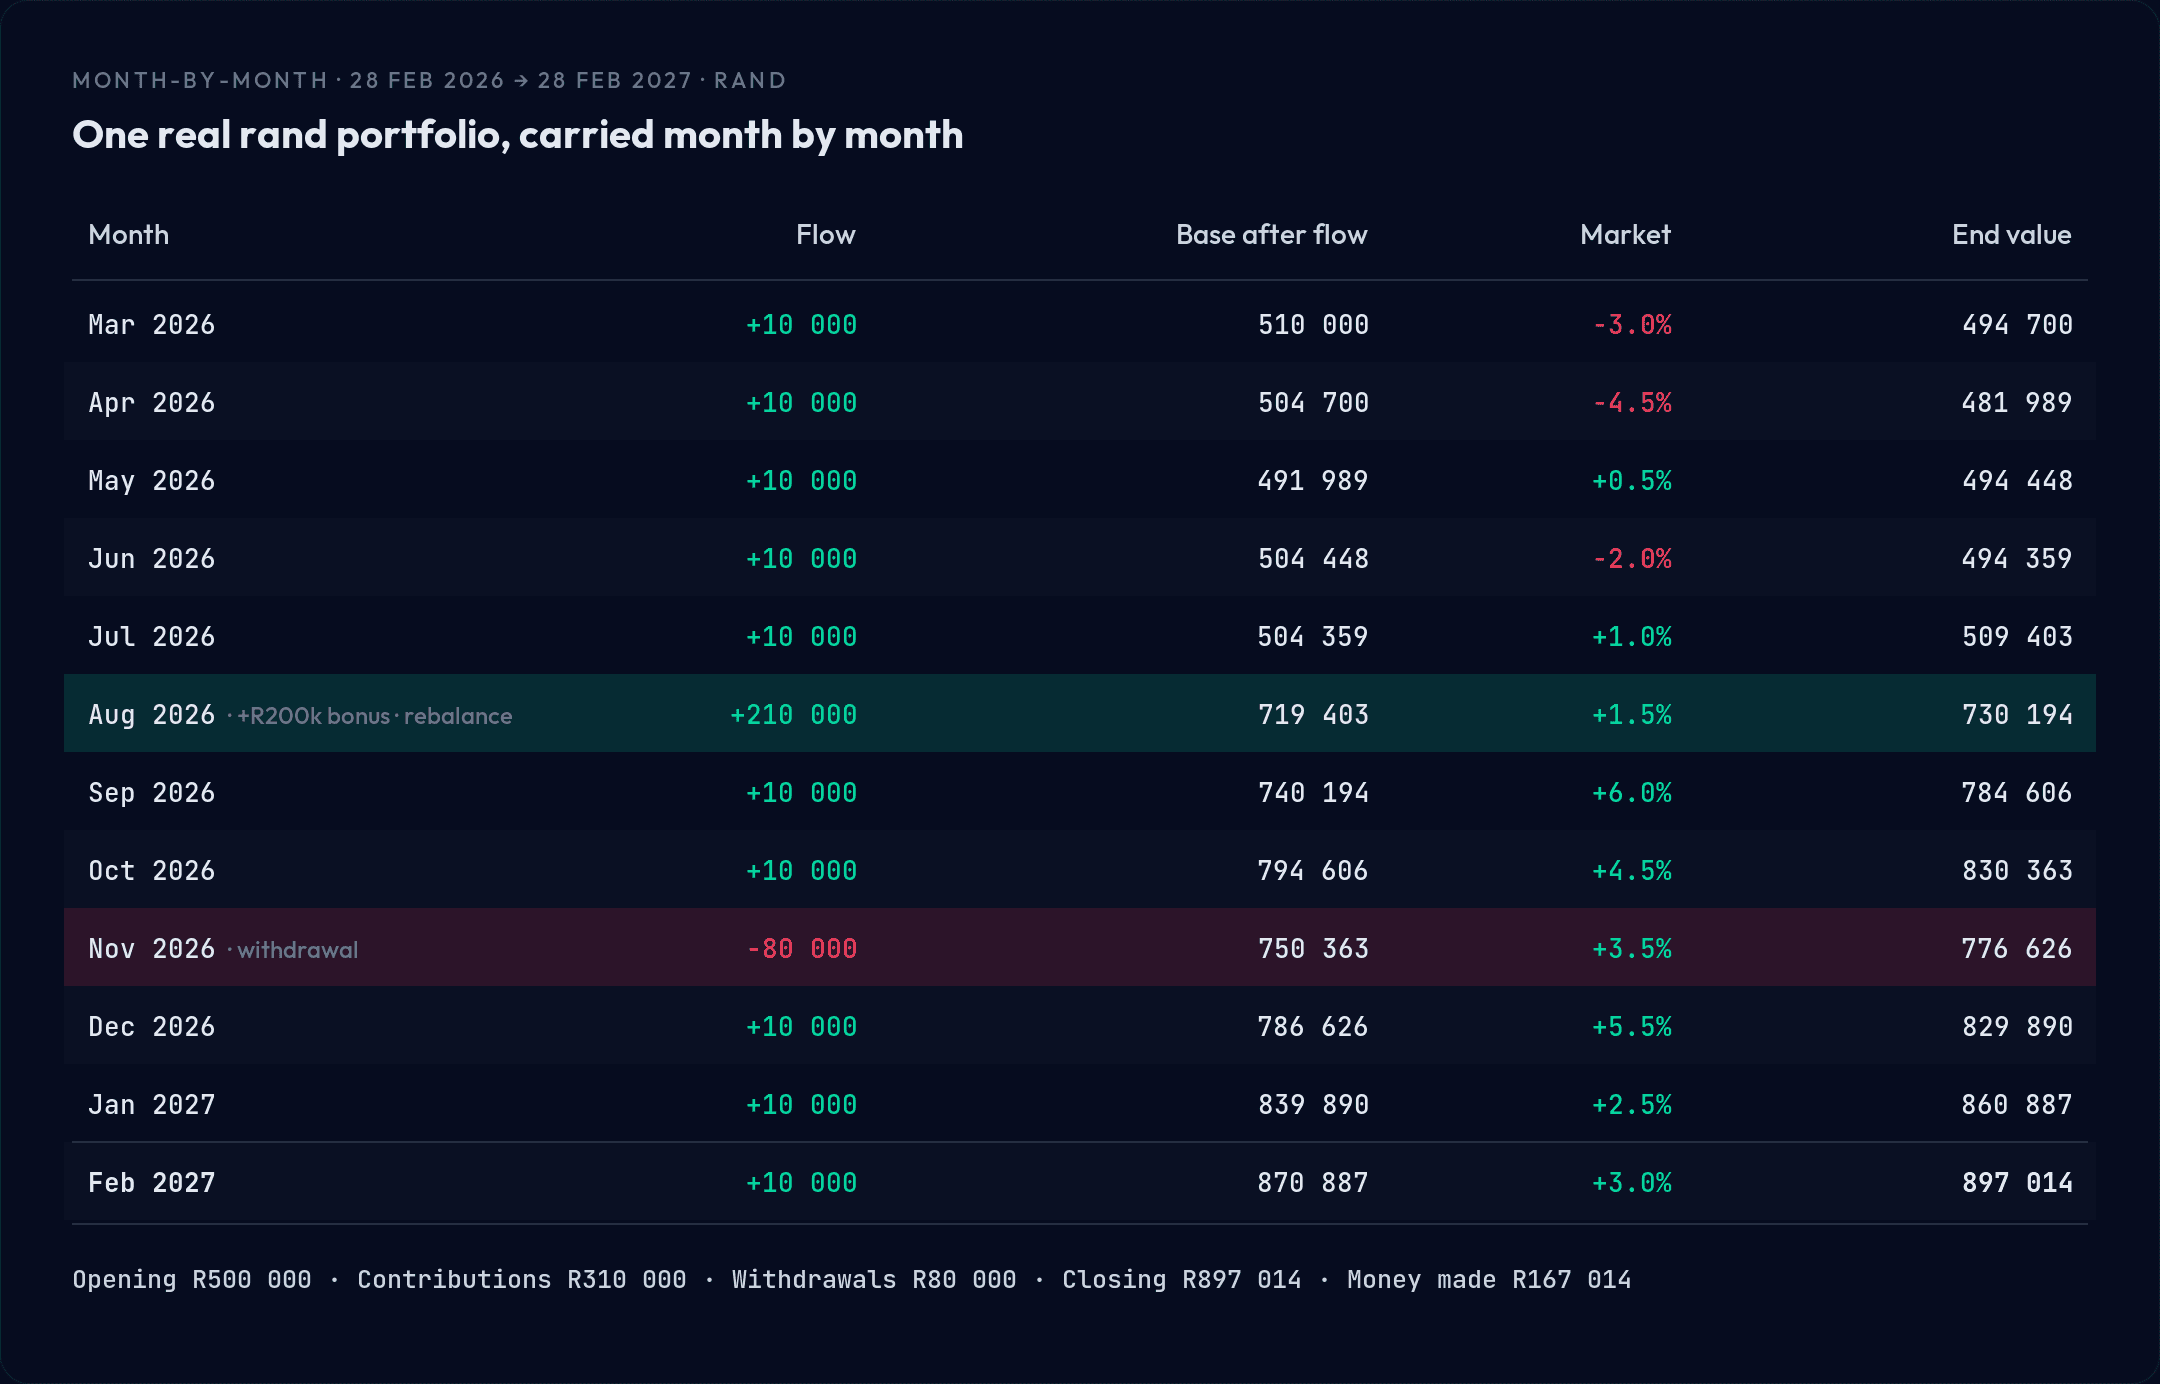
Opening R500,000. Total contributions R310,000 (eleven R10,000 instalments plus the R200,000 bonus). Withdrawals R80,000. Closing value R897,014. The money actually made — close, less opening, less the net you put in — is R167,014.
Now the same data, run through all three methods:
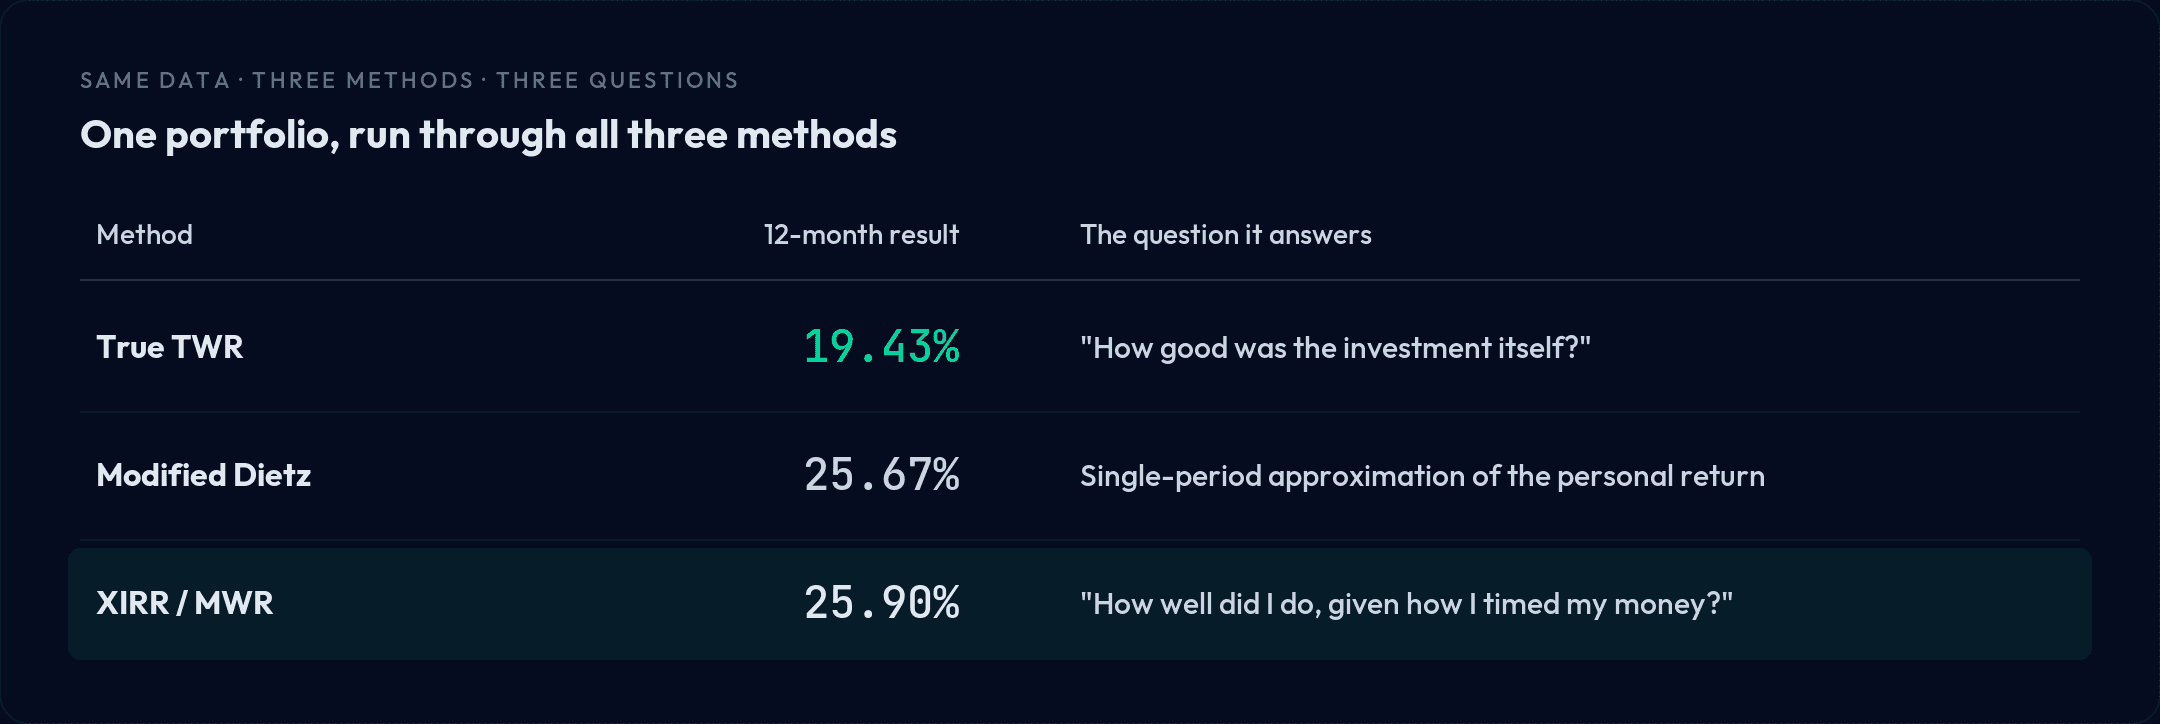
The headline: money-weighted return comes in 6.46 percentage points higher than time-weighted. Why? Because the R200,000 landed in August, right before the strong second half. Money-weighted return rewards having more capital deployed during the good months; time-weighted return strips that timing out and asks only how the underlying investment did. Same portfolio, same trades, two honest numbers more than six points apart — because they answer two different questions.
One detail that trips people up, and which this example is built to teach: the August rebalance does not appear anywhere in the cash-flow column. Selling fund A to buy fund B inside the portfolio moves nothing in or out — it's internal. Only the R10,000 contribution and the R200,000 bonus count as flows that month. The same goes for a reinvested dividend: it's internal, not a new contribution. Treat an internal move as a cash flow and you corrupt every one of these calculations.
For the money-weighted (XIRR) figure, the column Excel needs is the signed one: the opening R500,000 and every contribution are negative (money leaving your wallet into the portfolio); the R80,000 withdrawal and the closing R897,014 are positive (money available to you). That sign discipline is the single most common reason a personal XIRR comes out wrong.
The two mistakes this prevents
Most return confusion collapses into two errors, and the worked example inoculates against both.
The first is comparing your number to the fund's number. Your broker's personal figure may well be money-weighted; the fund factsheet beside it is time-weighted. Lay them next to each other and you're comparing apples to oranges — your contribution timing is baked into one and deliberately stripped from the other. In our example, holding up the investor's 25.90% "personal return" against a fund's published time-weighted figure would flatter them by more than six points, for no reason other than a well-timed bonus. That's not skill; that's the arithmetic of when the money arrived.
The second is treating internal moves as flows — the rebalance-and-dividend trap above. It sounds trivial. It isn't: it's the most common way a carefully built personal spreadsheet quietly produces a wrong answer, because nothing visibly breaks. The number still looks plausible. It's just wrong.
So, is your fund manager actually beating the market?
This is the question underneath all the others, and now it has a clean answer. To judge whether a fund beat its benchmark, you compare the fund's time-weighted return to the benchmark's time-weighted return, net of fees, over a long-enough window. Your personal money-weighted return cannot answer this — it's contaminated by your own contribution timing, which has nothing to do with the manager's skill. If you added a big lump just before a rally, your money-weighted return will look great even if the manager lagged the index; if you bought in right before a slump, you'll punish a manager who actually did fine. Time-weighted return is the only basis on which the comparison is fair, which is exactly why it's the global reporting standard and exactly why a fund's published number is time-weighted.
Here's the honest concession, because the smartest objection to all this is partly right. For judging your own performance — did my timing and discipline serve me? — money-weighted return is the more relevant number, and people who argue that individual investors should care about their money-weighted return are correct. The error was never "money-weighted is the wrong metric." The error is using one metric to answer the other's question. You need both: time-weighted to judge the fund, money-weighted to judge yourself. The reason a single percentage on a screen is so misleading is that it silently picks one and lets you believe it answered both.
That's the gap. Every platform shows you a number; almost none tells you which question it answered, and no South African platform will give you a true time-weighted return per fund — the thing you'd actually need to know whether Allan Gray, Coronation or Ninety One earned their fee.
The conclusion
A single, unlabelled return percentage is the problem, not the answer. What you actually want is the right number for the question you're asking — the fund's time-weighted return when you're judging the fund, your own money-weighted return when you're judging yourself, and the clarity to know which is which. Done properly, the two numbers together tell you something neither can alone: how much of your wealth's growth came from the investments, and how much from you. That separation — the Wealth Growth Attribution Waterfall — is the whole point of keeping the books honestly.
Rian Cronje spent 25 years in senior international finance in commodity trading, most recently as Group Financial Controller across multiple jurisdictions — before building Mintelo. He writes about the gap between what your statements say and what your wealth is actually doing, trying to answer deeply personal questions from his own wealth portfolio.
Sources
[1] Bogleheads.org forum thread, "Vanguard's Personal Rate Of Return Calculation Is Embarrassing" ; see also the Bogleheads wiki, "Calculating personal returns." Link (accessed 12 Jun 2026).
[2] Sharesight, "Time-weighted vs. money-weighted rates of return." Link (accessed 12 Jun 2026).
[3] CFA Institute, Global Investment Performance Standards (GIPS) — Guidance Statement on Calculation Methodology. Link (accessed 12 Jun 2026).
See your real net worth across every account — in rand or dollar.
One reconciled view, the same number whichever way it's checked. Mintelo is the personal wealth platform built like a real one.